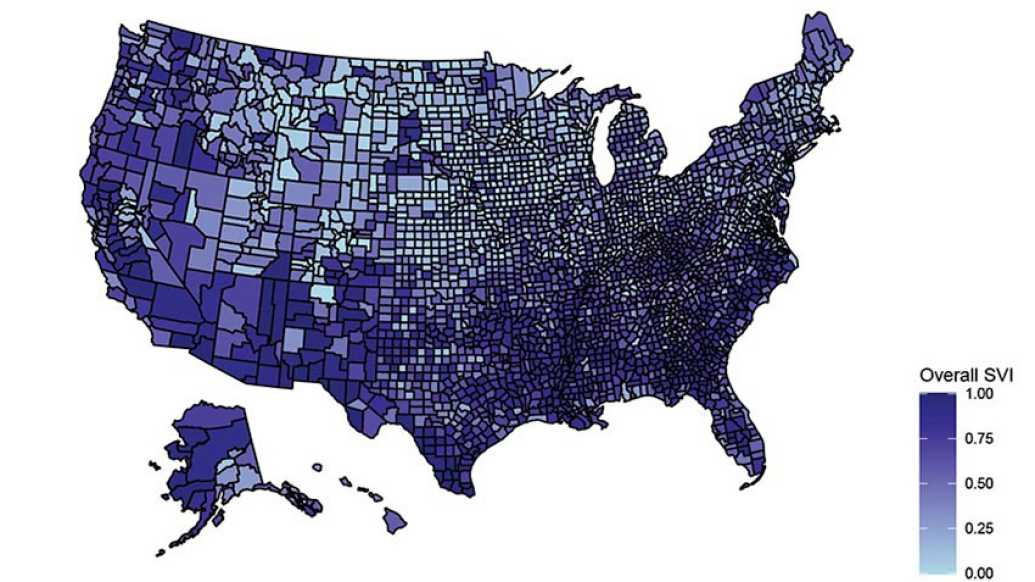
The higher a county’s score on a national index of social vulnerability, the more cases and deaths per 100,000 – highlighting the role of social factors in spread.
2:46 PM
Author |
In just one year, COVID-19 has killed more than 400,000 Americans, and infected more than 24 million others. But a new study shows just how unevenly those deaths and cases have played out across the country.
It finds that the more disadvantaged a county's population was before the pandemic, the higher the toll of coronavirus last spring and summer.
That level of disadvantage, measured on a standard scale called the Social Vulnerability Index (SVI), tracked closely with the number of cases and deaths per 100,000 residents in each county, according to the new University of Michigan study.
The ten-point SVI score combines many measures of the social disadvantage of a county's population, with higher scores meaning greater disadvantage. For every point higher on the ten-point SVI scale, counties had 14% higher incidence of COVID-19 cases, and 14% more deaths per 100,000 people, the team reports in JAMA Network Open.
That translates to 87 excess COVID-19 cases per 100,000 people, and 3 excess COVID-19 deaths per 100,000 people, for every step up the SVI scale.
Cases also rose faster in higher-SVI counties than in lower-SVI ones during the months the researchers analyzed, from late March to late July 2020.
Since half of COVID-19 cases come from virus spread by people who don't have symptoms, the findings have important implications for all Americans, say the researchers from the University of Michigan's Institute for Healthcare Policy and Innovation.
"These findings highlight that underlying inequality and social disadvantage, and its role in promoting the spread of coronavirus, is a problem that affects all of us, no matter where we live," says Renuka Tipirneni, M.D., M.Sc., the study's senior author. "This evidence contradicts the perception that COVID-19 mostly affects just one set of people in one kind of area."
She adds, "While the first surge was mainly in urban areas with high percentages of Black and Latinx residents, as time went on some of highest rates of cases and deaths were in rural counties with predominantly white populations. But across the board, we find the areas hardest-hit by the disease were linked by higher rates of social disadvantage."
The SVI, which factors in everything from income, language and education to housing, race and disability, is calculated by the Centers for Disease Control and Prevention based on national Census data.
Higher case and death rates were also seen in areas that had higher rates of measures that aren't included in the standard SVI, such as obesity, mass transit use, food insecurity and adults who lack health insurance.
Tipirneni, a primary care physician in the U-M Medical School's Department of Internal Medicine and health services researcher who has worked in multiple health care settings, worked with first author and senior statistician Monita Karmakar, Ph.D., M.S. for the intensive data analysis. Co-author Paula Lantz, Ph.D., a professor and associate dean at U-M's Ford School of Public Policy, helped evaluate the policy implications of the findings.
"Our findings highlight that there are pockets of disadvantage everywhere in America, and that they are playing a large role in the pandemic that's affecting all of us as we interact with one another," says Karmakar.
Factors most associated with higher COVID-19 impacts
The team looked at how SVI and other social measures related to 4.3 million cases and 147,074 deaths reported during the first 6 months of the pandemic in the US. They accounted for variation in population density and COVID testing rates.
The team then analyzed the SVI for each county. The ten-point score, which is expressed in terms of scores from 0.1 to 1.0, melds measures that include poverty rate, income and education level, housing type, English language ability, single-parent families, percent of people over 65 or under 17, access to a personal vehicle, racial and ethnic minority population percentage, and disability.
SEE ALSO: Seeking Medical Care During COVID-19
Digging down into the individual factors that made up the social vulnerability index, the researchers found that the higher the percentage of racial and ethnic minorities in a county's population, and the higher the percentage of people with limited English skills, the higher the COVID-19 case and death rates. The counties measuring highest on these factors had a 22% increase in case rate for every point up on their overall SVI score, and a 17% increase in death rate.
The percentage of the population that lives in over-crowded housing or in single-parent households was also associated with higher case incidence and death rates.
These findings highlight that underlying inequality and social disadvantage, and its role in promoting the spread of coronavirus, is a problem that affects all of us, no matter where we live.Renuka Tipirneni, M.D., M.Sc.
Looking at factors that aren't included in the official SVI, the researchers found many linkages with COVID-19. Interestingly, the concentration of health care resources available in the county did not seem to make a significant difference, though Tipirneni cautions that as more hospitals become overwhelmed with COVID-19 patients in the fall and early-winter surges, that may have changed.
However, a higher rate of obesity among a county's residents, the more adults that lacked health insurance, the more adults who rely on public transportation to get to and from work, and the more people who have unstable food supplies, the higher the rates of COVID-19 cases and deaths.
Most-impacted counties
Of the 3,137 counties analyzed, Trousdale County, Tennessee came in as the county with the highest incidence of COVID-19 cases during the study period, with 16,348 cases per 100,000 people by the end of July 2020. This was mainly linked to a COVID-19 outbreak in spring that sickened more than 1,300 inmates at a correctional center located there. This helped explain its high caseload despite having an SVI score of 0.52, near the middle of the scale.
But the next four counties with the highest COVID-19 case rates from January through July were all much higher on the SVI scale, including Lake County, Tennessee and Lee County, Arkansas with SVI scores over 0.9. Dakota County, Nebraska (0.86) and Buena Vista County, Iowa (0.74), came in fourth and fifth. The latter two are also rural counties with small populations that are home to a prison that was the center of a large outbreak.
MORE FROM THE LAB: Subscribe to our weekly newsletter
The county with the highest death rate, Hancock County, Georgia, had an overall SVI score of 0.80, with a population of 8,000 people seeing a high number of nursing home deaths. The four next-highest counties – three of them in Georgia, and one in New Mexico – all had SVI scores over 0.9.
The study team has made an Excel spreadsheet of the SVI scores and COVID-19 incidence and mortality rates for every county in the study through July 29 available online. An interactive visualization will be available soon.
The study did not include data from for U.S. territories, nor for New York City because at the time of the analysis, the city did not release county-level data for the five counties that make it up. However, the authors performed an analysis that considered New York City data as if it were a single county, and found it did not change their findings.
Policy implications for community COVID-19 impact
The authors note that the new findings support the broader importance of "social determinants of health" – upstream factors about a person's life circumstances that cause differences in their risk of health conditions. Such determinants are known to put someone at higher risk of the conditions that would put them at higher risk of developing a severe case of COVID-19 if they get infected, including diabetes, high blood pressure and lung disease.
Counties with high SVI scores are likely to have higher percentages of essential workers in frontline jobs. They're also likely to have more people living in homes and commuting in conditions that make social distancing and isolation of the sick difficult.
SEE ALSO: Keeping Our Patients Safe During COVID-19
"The longstanding inequality that led to the higher social vulnerability scores in the hardest-hit counties is likely to get worse because of the pandemic," says Lantz. "The tragic Catch-22 of the COVID-19 pandemic is that its economic and social consequences are going to further exacerbate social inequalities and community-level social vulnerability. Investments in public policies that protect everyone, like paid sick leave, affordable housing, high-quality education and health insurance are needed to reduce the social inequalities that drive every type of health inequality, including COVID-19."
As policymakers grapple with the root causes, immediate impacts and downstream effects of the inequities identified, the researchers hope the new findings will help them target their efforts.
SEE ALSO: Similar Factors Cause Health Disparities in Cancer, COVID-19
Immediate efforts might include public outreach campaigns aimed at people with lower English proficiency, focused efforts to expand COVID-19 testing, treatment and vaccination in the hardest-hit areas, and assistance with housing and food coordinated among government and nonprofit service agencies.
The team previously calculated COVID-19 incidence and mortality rates by SVI for the counties of Michigan, and provided the data to the state. It has been shared with the state's task force that targets COVID-19 testing locations and other services.
In the meantime, the team hopes that future research could look at even smaller geographic areas, down to the community, ZIP code or Census tract level, as well as data about the types of jobs worked by people in a given area. New efforts by the Agency for Healthcare Research and Quality, and the local-area social vulnerability resources from the University of Wisconsin and the Robert Wood Johnson Foundation, can also help further efforts to study and act on differences in advantage.
Like Podcasts? Add the Michigan Medicine News Break on iTunes, Google Podcast or anywhere you listen to podcasts.
Explore a variety of healthcare news & stories by visiting the Health Lab home page for more articles.

Department of Communication at Michigan Medicine
Want top health & research news weekly? Sign up for Health Lab’s newsletters today!